1. 项目准备

1.1. 问题导入

数据可视化,是一种利用计算机图形学和图像处理技术,将数据转换成图像在屏幕上显示出来,再进行交互处理的理论、方法和技术。
本次实践基于丁香园公开的统计数据,实现新冠疫情可视化,包括疫情地图、疫情增长趋势图、疫情分布图等。

1.2. Pyecharts模块

我们使用的数据可视化模块是Pyecharts,具体使用方法可参考>> Pyecharts 中文手册

  • 安装pyecharts
1
!pip install -i https://pypi.tuna.tsinghua.edu.cn/simple pyecharts
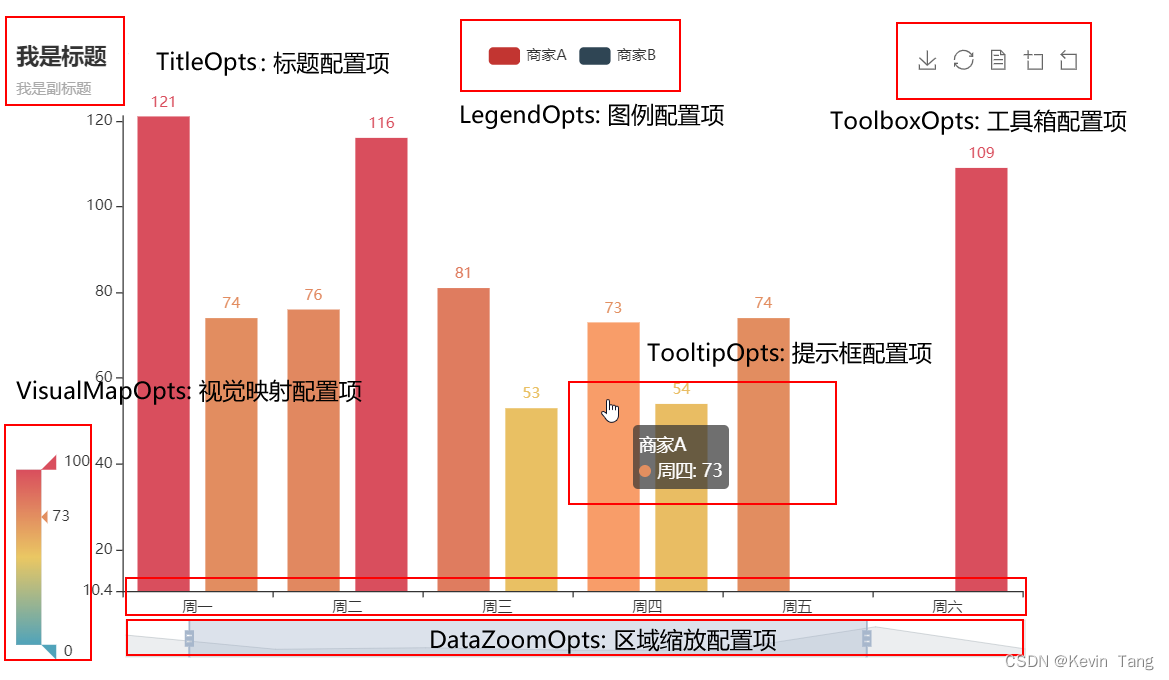
  • pyecharts 配置项
  • 系列配置组件
    系列配置项 set_series_opts(),可配置图元样式、文字样式、标签样式、点线样式等
  • 全局配置组件
    全局配置项 set_global_opts(),可配置标题、动画、坐标轴、图例等

2. 实验步骤

2.1. 爬取疫情数据

  • 爬虫过程
    模拟浏览器 → 往目标站点发送请求 → 接收响应数据 → 提取有用的数据 → 保存到本地/数据库
1
2
3
4
5
6
7
8
9
10
11
12
13
14
15
16
17
18
19
20
21
22
23
24
25
26
27
28
29
30
31
32
33
34
35
36
37
38
39
40
41
42
import re
import json
import requests
import datetime


# 爬取丁香园实时统计数据,保存到data目录的JSON文件中,以当前日期作为文件名
def crawlCurrentData():
resp = requests.get('https://ncov.dxy.cn/ncovh5/view/pneumonia')
resp.encoding = resp.apparent_encoding
try:
content = re.search(r"window.getAreaStat = (.*?)}]}catch", resp.text, re.S)
texts = content.group() # 获取匹配正则表达式的整体结果
string = texts.replace("window.getAreaStat = ", "").replace("}catch", "")
json_data = json.loads(string) # 转化为dict类型
with open("data/%s.json" % today, 'w', encoding='utf-8') as f:
json.dump(json_data, f, ensure_ascii=False)
except:
print('<Response [%s]>: https://ncov.dxy.cn/ncovh5/view/pneumonia' % resp.status_code)


# 获取各个省份的历史统计数据,保存到data目录的JSON文件中
def crawlStatisticsData():
data = {}
with open("data/%s.json" % today, 'r', encoding='utf-8') as f:
array = json.loads(f.read())

for province in array:
resp = requests.get(province['statisticsData']) # 获取省份的历史统计数据
resp.encoding = resp.apparent_encoding
try:
data[province["provinceShortName"]] = json.loads(resp.text)
except:
print('<Response [%s]>:[%s]' % (resp.status_code, province['statisticsData']))

with open("data/history.json", 'w', encoding='utf-8') as f:
json.dump(data, f, ensure_ascii=False)


today = datetime.date.today().strftime('%Y-%m-%d')
crawlCurrentData()
crawlStatisticsData()

2.2. 绘制疫情地图

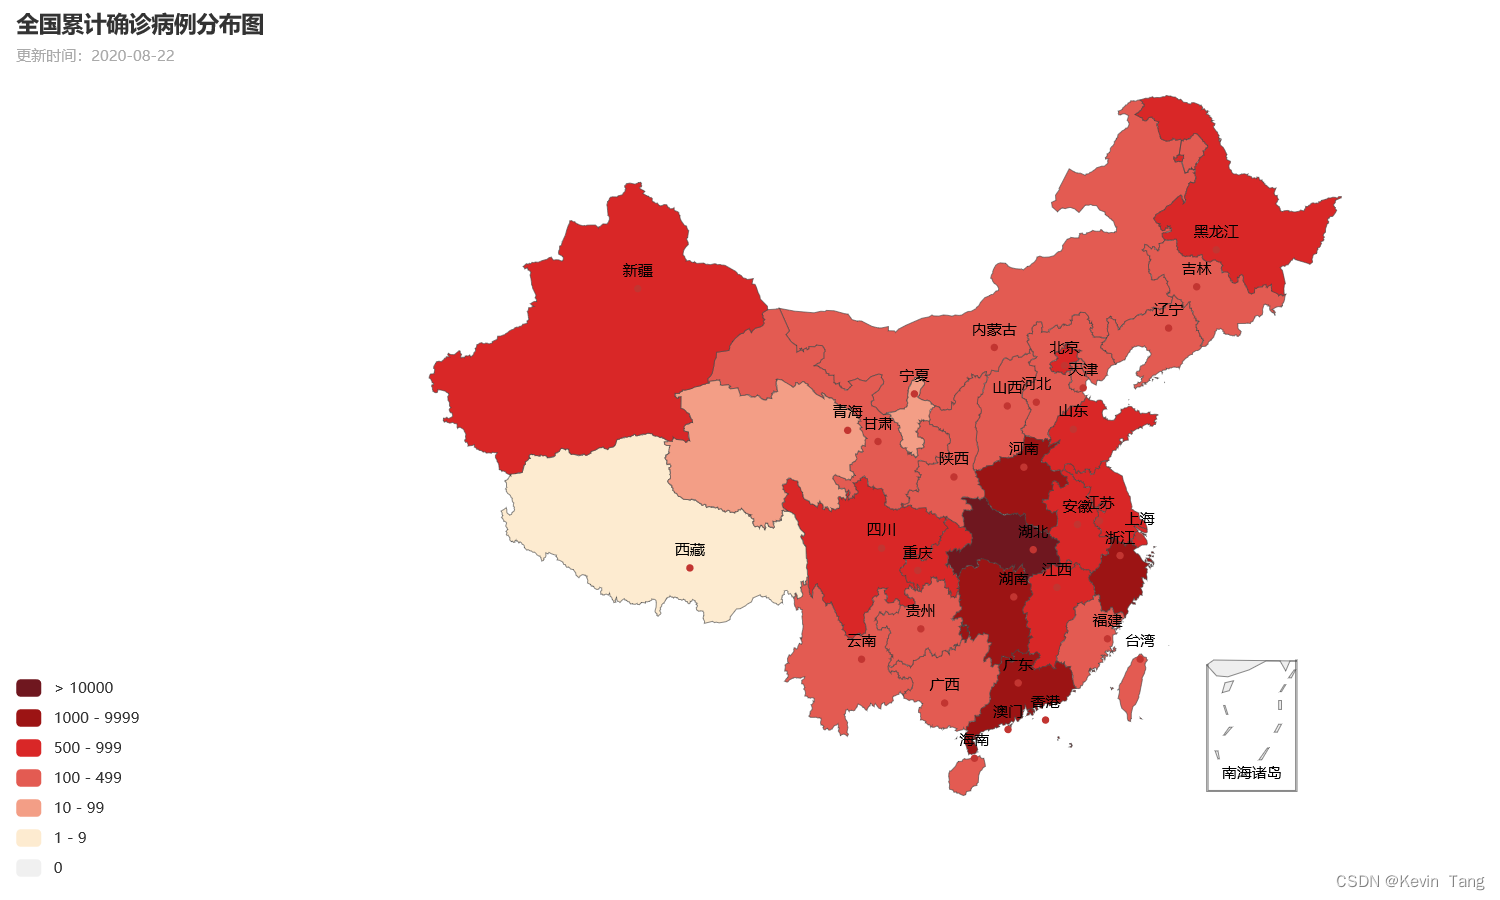
(1) 全国疫情地图

1
2
3
4
5
6
7
8
9
10
11
12
13
14
15
16
17
18
19
20
21
22
23
24
25
26
27
28
29
30
31
32
33
34
35
36
37
38
39
40
41
42
43
44
45
import json
import datetime
from pyecharts import options as opts
from pyecharts.charts import Map


def createChinaMap(data, title): # 创建中国疫情地图
# (1) 创建Map对象并配置数据:
m = Map(
init_opts=opts.InitOpts(width='1400px', height='700px') # 设置图像的长和宽
) # 创建Map对象
m.add(title, [list(z) for z in data.items()], 'china')

# (2) 设置系列配置项:
m.set_series_opts(
label_opts=opts.LabelOpts(font_size=12), # 设置标签的字体样式
is_show=False
)

# (3) 设置全局配置项:
pieces = [
{'min': 10000, 'color': '#6F171F'},
{'max': 9999, 'min': 1000, 'color': '#9c1414'},
{'max': 999, 'min': 500, 'color': '#d92727'},
{'max': 499, 'min': 100, 'color': '#E35B52'},
{'max': 99, 'min': 10, 'color': '#F39E86'},
{'max': 9, 'min': 1, 'color': '#FDEBD0'},
{"min": 0, "max": 0, "color": "#f0f0f0"}
] # 自定义每个区间的范围及其特殊样式
m.set_global_opts(
title_opts=opts.TitleOpts(
title = '全国%s病例分布图' % title,
subtitle = "更新时间:" + today
), # 设置地图的一级标题和二级标题
legend_opts=opts.LegendOpts(is_show=False), # 不显示图例
visualmap_opts=opts.VisualMapOpts(
is_piecewise=True, # 分段显示数据
pieces=pieces, # 各区间的显示样式
is_show=True # 是否显示视觉映射配置
)
)

# (4) 保存疫情地图:
m.render(path="data/国内疫情地图-%s.html" % title)

1
2
3
4
5
6
7
8
9
10
11
12
13
14
15
16
17
# ------ 1. 读取初始数据文件 ------
today = datetime.date.today().strftime("%Y-%m-%d")
with open('data/%s.json' % today, 'r', encoding='utf-8') as f:
json_array = json.loads(f.read())

# ------ 2. 提取全国确诊数据 ------
cn_confirm = {"count": {}, "current": {}} # count:累计确诊;current:现存确诊
for province in json_array:
name = province["provinceShortName"] # 省级行政区名
cn_confirm["count"][name] = province["confirmedCount"]
# cn_confirm["current"][name] = province["currentConfirmedCount"]
print("累计确诊:", cn_confirm["count"])
# print("现存确诊:", cn_confirm["current"])

# ------ 3. 绘制全国疫情地图 ------
createChinaMap(cn_confirm["count"], "累计确诊")
# createChinaMap(cn_confirm["current"], "现存确诊")
1
累计确诊: {'香港': 4657, '新疆': 902, '上海': 875, '山东': 830, '台湾': 487, '广东': 1725, '陕西': 360, '四川': 628, '辽宁': 261, '天津': 216, '江苏': 665, '浙江': 1277, '福建': 371, '河北': 354, '云南': 195, '江西': 935, '北京': 935, '内蒙古': 260, '湖北': 68139, '黑龙江': 948, '河南': 1276, '湖南': 1019, '安徽': 991, '重庆': 583, '广西': 255, '山西': 201, '海南': 171, '甘肃': 169, '吉林': 157, '贵州': 147, '宁夏': 75, '澳门': 46, '青海': 18, '西藏': 1}

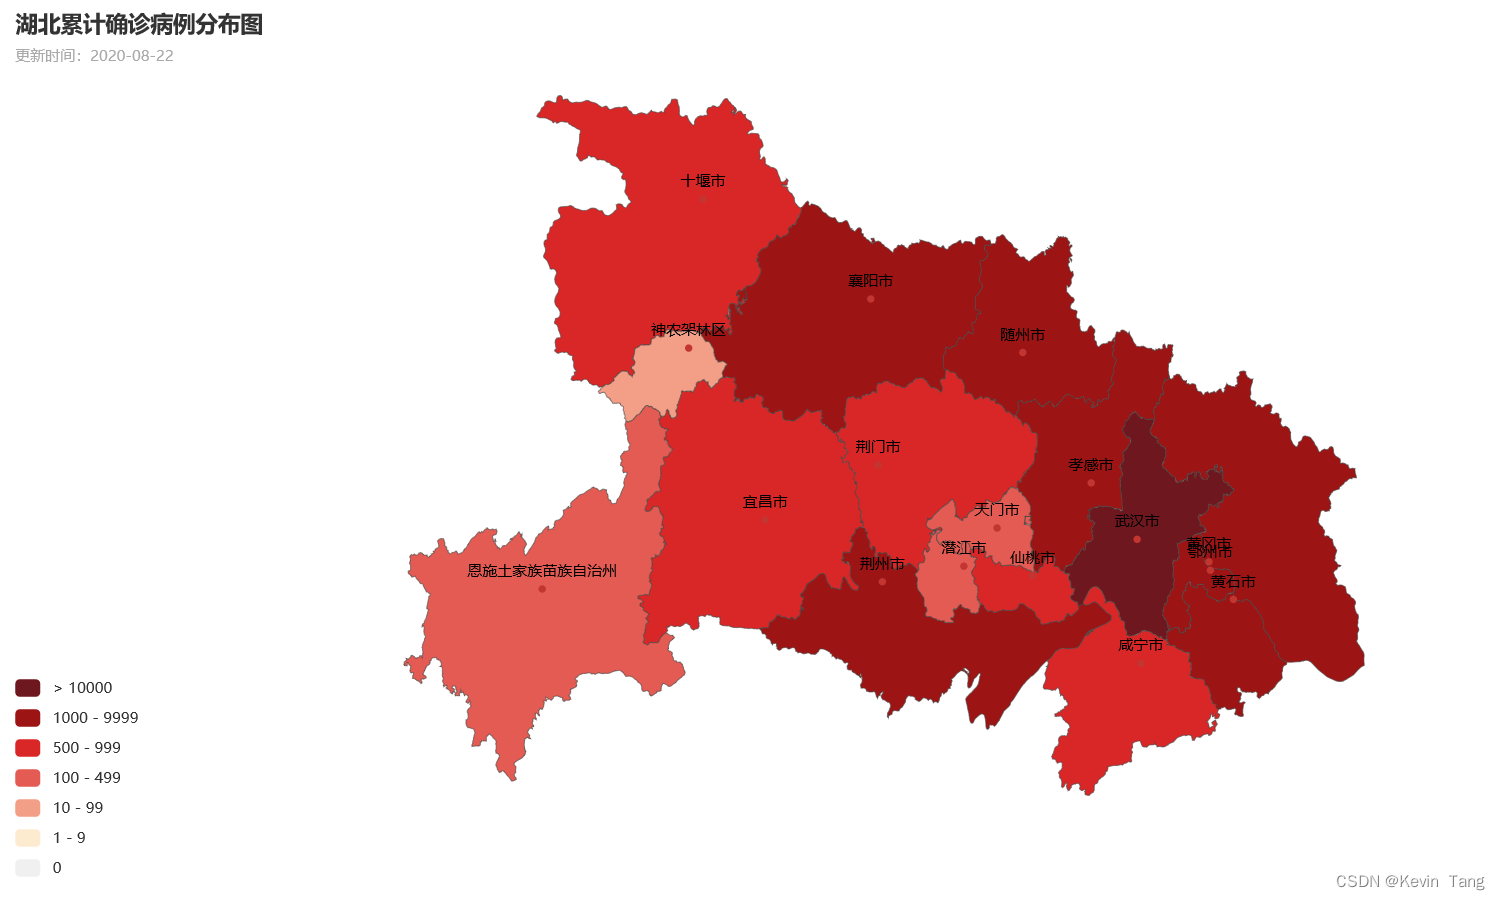
(2) 省级疫情地图

1
2
3
4
5
6
7
8
9
10
11
12
13
14
15
16
17
18
19
20
21
22
23
24
25
26
27
28
29
30
31
32
33
34
35
36
37
38
39
40
41
42
43
44
45
46
47
48
49
50
51
52
53
54
import json
import datetime
from pyecharts import options as opts
from pyecharts.charts import Map


def formatCityName(name, defined_cities): # 规范化城市名
for city in defined_cities:
if len((set(city) & set(name))) == len(name):
if city.endswith("市") or city.endswith("区") or city.endswith("县") or city.endswith("自治州"):
return city
return city + "市"
return None


def createProvinceMap(data, province, title): # 创建省级疫情地图
# (1) 创建Map对象并配置数据:
m = Map(
init_opts=opts.InitOpts(width='1400px', height='700px') # 设置图像的长和宽
) # 创建Map对象
m.add(title, [list(z) for z in data.items()], province)

# (2) 设置系列配置项:
m.set_series_opts(
label_opts=opts.LabelOpts(font_size=12), # 设置标签的字体样式
is_show=False
)

# (3) 设置全局配置项:
pieces = [
{'min': 10000, 'color': '#6F171F'},
{'max': 9999, 'min': 1000, 'color': '#9c1414'},
{'max': 999, 'min': 500, 'color': '#d92727'},
{'max': 499, 'min': 100, 'color': '#E35B52'},
{'max': 99, 'min': 10, 'color': '#F39E86'},
{'max': 9, 'min': 1, 'color': '#FDEBD0'},
{"min": 0, "max": 0, "color": "#f0f0f0"}
] # 自定义每个区间的范围及其特殊样式
m.set_global_opts(
title_opts=opts.TitleOpts(
title = '%s%s病例分布图' % (province, title),
subtitle = "更新时间:" + today
), # 设置地图的一级标题和二级标题
legend_opts=opts.LegendOpts(is_show=False), # 不显示图例
visualmap_opts=opts.VisualMapOpts(
is_piecewise=True, # 分段显示数据
pieces=pieces, # 各区间的显示样式
is_show=True # 是否显示视觉映射配置
)
)

# (4) 保存疫情地图:
m.render(path="data/%s疫情地图-%s.html" % (province, title))

1
2
3
4
5
6
7
8
9
10
11
12
13
14
15
16
17
18
19
20
21
22
23
# ------ 1. 读取初始数据文件 ------
today = datetime.date.today().strftime("%Y-%m-%d")
with open('data/%s.json' % today, 'r', encoding='utf-8') as f:
json_list = json.loads(f.read())
with open('data/data24815/pycharts_city.txt', 'r', encoding='UTF-8') as f:
defined_cities = [line.strip() for line in f.readlines()]

# ------ 2. 处理所选省份的确诊数据 ------
province_name = '湖北'
confirm = {"count": {}, "current": {}} # count:累计确诊;current:现存确诊
for province in json_list:
if province["provinceShortName"] == province_name:
city_array = province['cities'] # 获取所辖城市的疫情数据
for city in city_array:
city_name = formatCityName(city["cityName"], defined_cities)
confirm["count"][city_name] = city["confirmedCount"] # 累计确诊
confirm["current"][city_name] = city["currentConfirmedCount"] # 现存确诊
print("%s累计确诊:" % province_name, confirm["count"])
# print("%s现存确诊:" % province_name, confirm["current"])

# ------ 3. 绘制省级疫情地图 ------
createProvinceMap(confirm["count"], province_name, "累计确诊")
# createProvinceMap(confirm["current"], province_name, "现存确诊")
1
湖北累计确诊: {'武汉市': 50344, '孝感市': 3518, '黄冈市': 2907, '荆州市': 1580, '鄂州市': 1394, '随州市': 1307, '襄阳市': 1175, '黄石市': 1015, '宜昌市': 931, '荆门市': 928, '咸宁市': 836, '十堰市': 672, '仙桃市': 575, '天门市': 496, '恩施土家族苗族自治州': 252, '潜江市': 198, '神农架林区': 11}

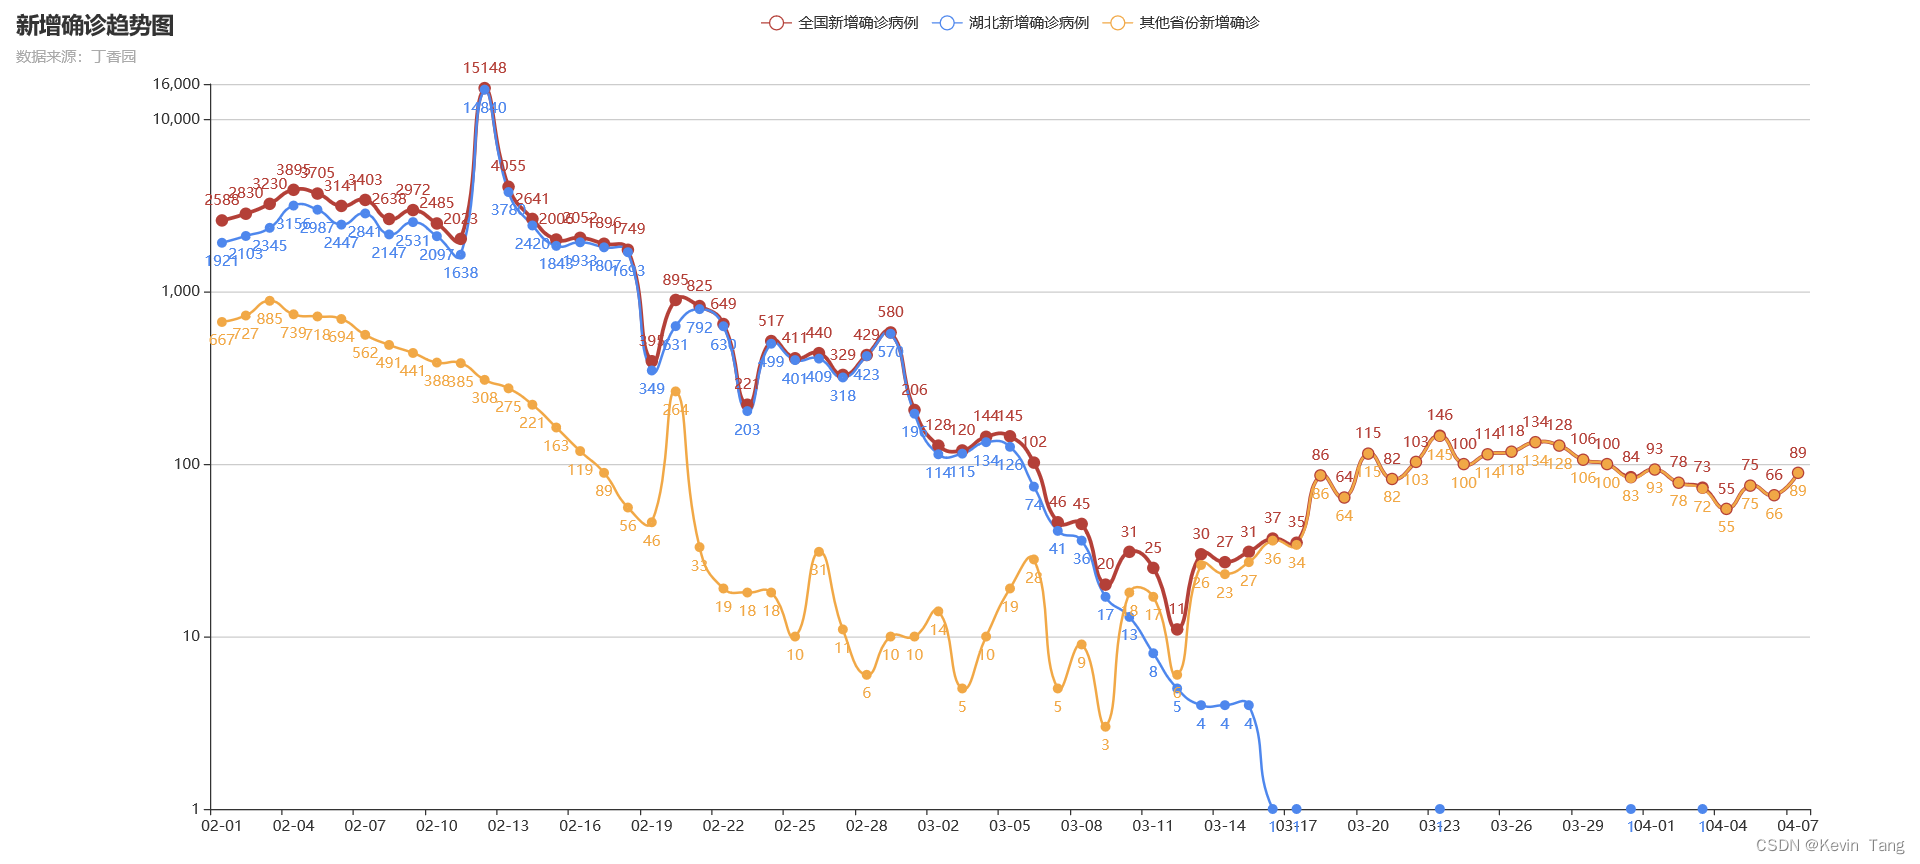
2.3. 绘制疫情趋势图

1
2
3
4
5
6
7
8
9
10
11
12
13
14
15
16
17
18
19
20
21
22
23
24
25
26
27
28
29
30
31
32
33
34
35
36
37
38
39
40
41
42
43
44
45
46
47
48
49
50
51
52
53
54
55
56
57
58
59
60
61
62
63
64
65
66
67
68
69
import numpy as np
import json
from pyecharts.charts import Line
from pyecharts import options as opts

# ------ 1. 读取原始数据文件 ------
with open("data/history.json", 'r', encoding='utf-8') as f:
json_dict = json.loads(f.read())

# ------ 2. 提取各省份新增确诊数据 ------
history = {}
for province in json_dict: # 提取各省份2月1日至4月7日的新增确诊数据
history[province] = []
for day in json_dict[province]["data"]:
if 20200201 <= day["dateId"] <= 20200407:
history[province].append(day["confirmedIncr"])

# ------ 3.1.获取日期列表 ------
dates = ["%s-%s" % (str(d["dateId"])[4:6], str(d["dateId"])[6:8])
for d in json_dict["湖北"]["data"] if 20200201<=d["dateId"]<=20200407
]

# ------ 3.2.提取全国新增确诊数据 ------
cn_history = np.array([0] * len(dates)) # 初始化一个长度为len(dates)的数组
for province in history:
cn_history += np.array(history[province])
cn_history = cn_history.tolist() # 将numpy数组转化成列表

# ------ 3.3.提取湖北及其他省份的数据 ------
hb_history = history["湖北"]
ot_history = [cn_history[i]-hb_history[i] for i in range(len(dates))]

# ------ 4. 绘制新增确诊趋势图 ------
line = Line(
init_opts=opts.InitOpts(width='1500px', height='700px') # 设置图像的长和宽
) # 创建Line对象
line.add_xaxis(dates) # 添加横轴数据
line.add_yaxis(
"全国新增确诊病例", cn_history, is_smooth=True, # 图例、数据、是否平滑曲线
linestyle_opts=opts.LineStyleOpts(width=3, color="#B44038"), # 线条样式配置项
itemstyle_opts=opts.ItemStyleOpts(
color='#B44038', border_color="#B44038", border_width=6
) # 图元样式设置项
)
line.add_yaxis(
"湖北新增确诊病例", hb_history, is_smooth=True,
linestyle_opts=opts.LineStyleOpts(width=2, color="#4E87ED"),
label_opts=opts.LabelOpts(position="bottom"), # 设置数据标签的位置
itemstyle_opts=opts.ItemStyleOpts(
color="#4E87ED", border_color="#4E87ED", border_width=4
)
)
line.add_yaxis(
"其他省份新增确诊", ot_history, is_smooth=True,
linestyle_opts=opts.LineStyleOpts(width=2, color="#F1A846"),
label_opts=opts.LabelOpts(position="bottom"),
itemstyle_opts=opts.ItemStyleOpts(
color="#F1A846", border_color="#F1A846", border_width=4
)
)
line.set_global_opts(
title_opts=opts.TitleOpts(title="新增确诊趋势图", subtitle="数据来源:丁香园"),
yaxis_opts=opts.AxisOpts(
max_=16000, min_=1, type_="log", # 坐标轴配置项
splitline_opts=opts.SplitLineOpts(is_show=True), # 分割线配置项
axisline_opts=opts.AxisLineOpts(is_show=True) # 坐标轴刻度线配置项
)
)
line.render("data/国内新增确诊数趋势图.html")

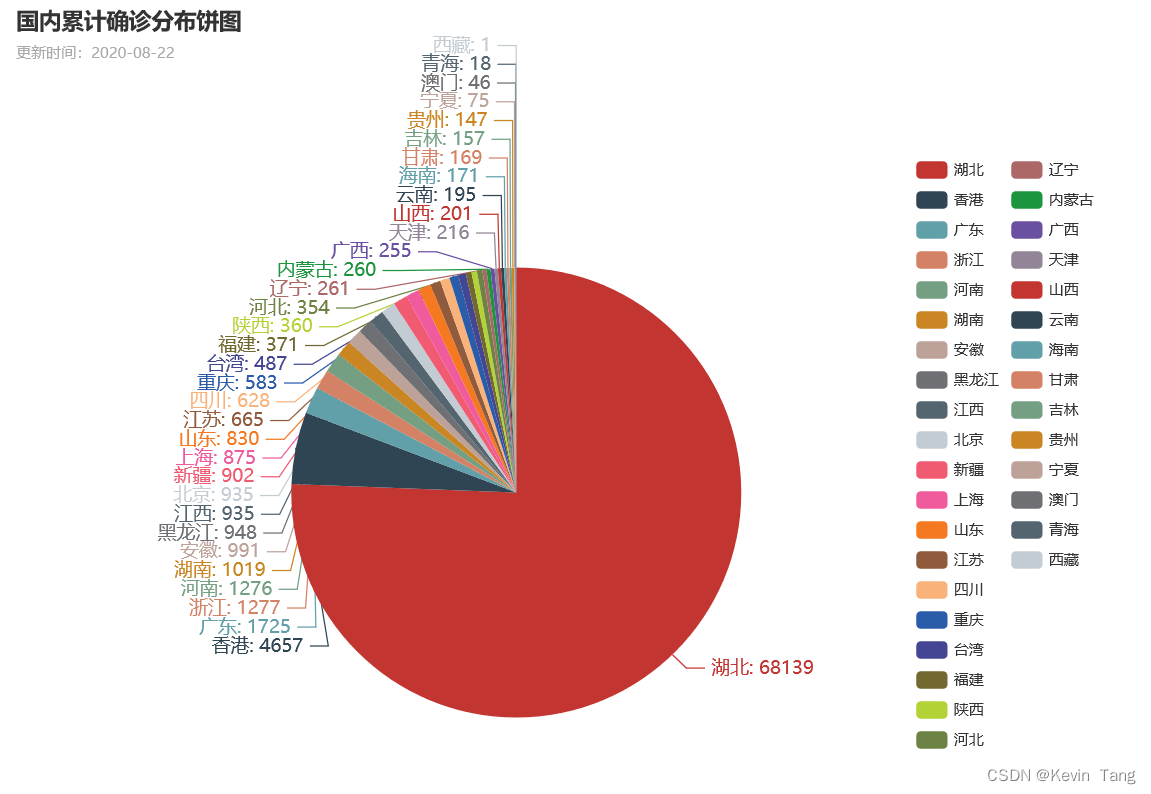
2.4. 绘制疫情分布饼图

1
2
3
4
5
6
7
8
9
10
11
12
13
14
15
16
17
18
19
20
21
22
23
24
25
26
27
28
import json
import datetime
from pyecharts.charts import Pie
from pyecharts import options as opts


def createPieGraph(data, title):
pie = Pie(
init_opts=opts.InitOpts(width='900px', height='600px') # 设置图像的长和宽
) # 创建Pie对象
data_pair = [list(z) for z in data.items()]
data_pair.sort(key=lambda x: x[1], reverse=True)
pie.add(title, data_pair,
center=["45%", "65%"], # 饼图圆心坐标:前者相对于宽度,后者相对于高度
radius="180") # 饼图的半径
pie.set_series_opts(
label_opts=opts.LabelOpts(formatter="{b}: {c}", # 标签格式
font_size=15) # 字体大小
) # 系列配置项
pie.set_global_opts(
title_opts=opts.TitleOpts(title="国内%s分布饼图" % title,
subtitle="更新时间:%s" % today), # 设置标题
legend_opts=opts.LegendOpts(pos_top="20%", # 图例离顶部的距离
pos_left="80%", # 图例离左侧的距离
orient="vertical") # 图例的布局朝向
) # 全局配置项
pie.render("data/国内%s分布饼图.html" % title) # 保存图像至文件

1
2
3
4
5
6
7
8
9
10
11
12
13
14
15
16
17
# ------ 1. 读取原始数据文件 ------
today = datetime.date.today().strftime('%Y-%m-%d')
with open("data/%s.json" % today, "r", encoding="utf-8") as f:
json_list = json.loads(f.read())

# ------ 2. 提取全国确诊数据 ------
cn_confirm = {"count": {}, "current": {}} # count:累计确诊;current:现存确诊
for province in json_array:
name = province["provinceShortName"] # 省级行政区名
cn_confirm["count"][name] = province["confirmedCount"]
# cn_confirm["current"][name] = province["currentConfirmedCount"]
# print("累计确诊:", cn_confirm["count"])
# print("现存确诊:", cn_confirm["current"])

# ------ 3. 绘制疫情分布饼图 ------
createPieGraph(cn_confirm["count"], "累计确诊")
# createPieGraph(cn_confirm["current"], "现存确诊")


写在最后

  • 如果您发现项目存在问题,或者如果您有更好的建议,欢迎在下方评论区中留言讨论~
  • 这是本项目的链接:实验项目 - AI Studio,点击fork可直接在AI Studio运行~
  • 这是我的个人主页:个人主页 - AI Studio,来AI Studio互粉吧,等你哦~